Oftentimes at our office hours, we highlight our top tips for users who are looking to make better reports, faster. Reports in Salesforce are the easiest way to leverage your data. They let you query, count and interpret all the information you’ve worked so hard to get in to HomeKeeper and Salesforce.
There’s a lot to learn, so we want to summarize our top tips for creating reports. They’ll save you time, get you inspired and help you stay on top of the latest new features Salesforce has released! We already covered this topic in Make Faster, Better Reports! (Part I).
1. Want a Chart? Make sure to Group.
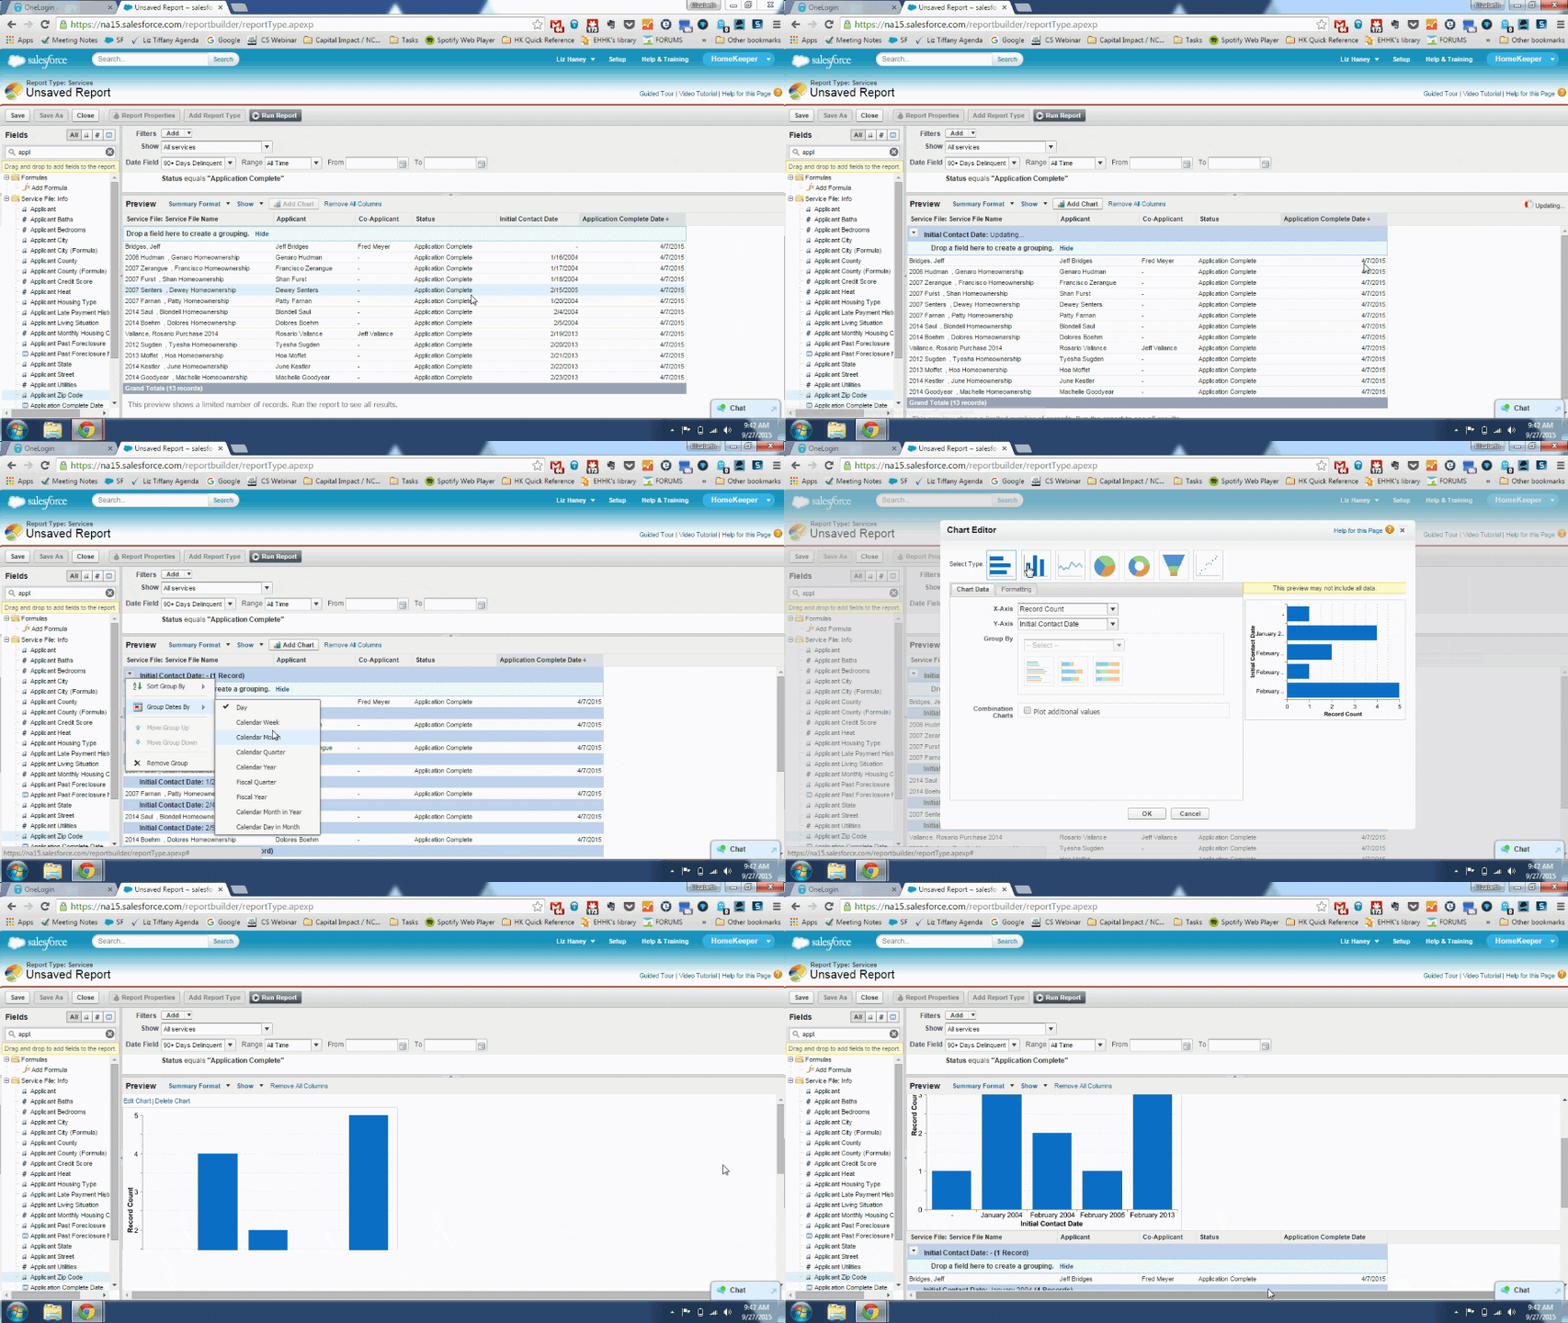
You can add a field into the section called “Drop a Field Here to Create a Grouping” or use the drop down on a field to “Group by this Field.”
Either way, once you add a grouping, you should see the “Add a Chart” button pop up on your report, where you can start formatting and editing the chart. Adding more groupings means you can display additional groupings in your chart. To add more relevant metrics to a chart, add a grouping of the relevant field.
2. Use Date Groupings for more helpful reports
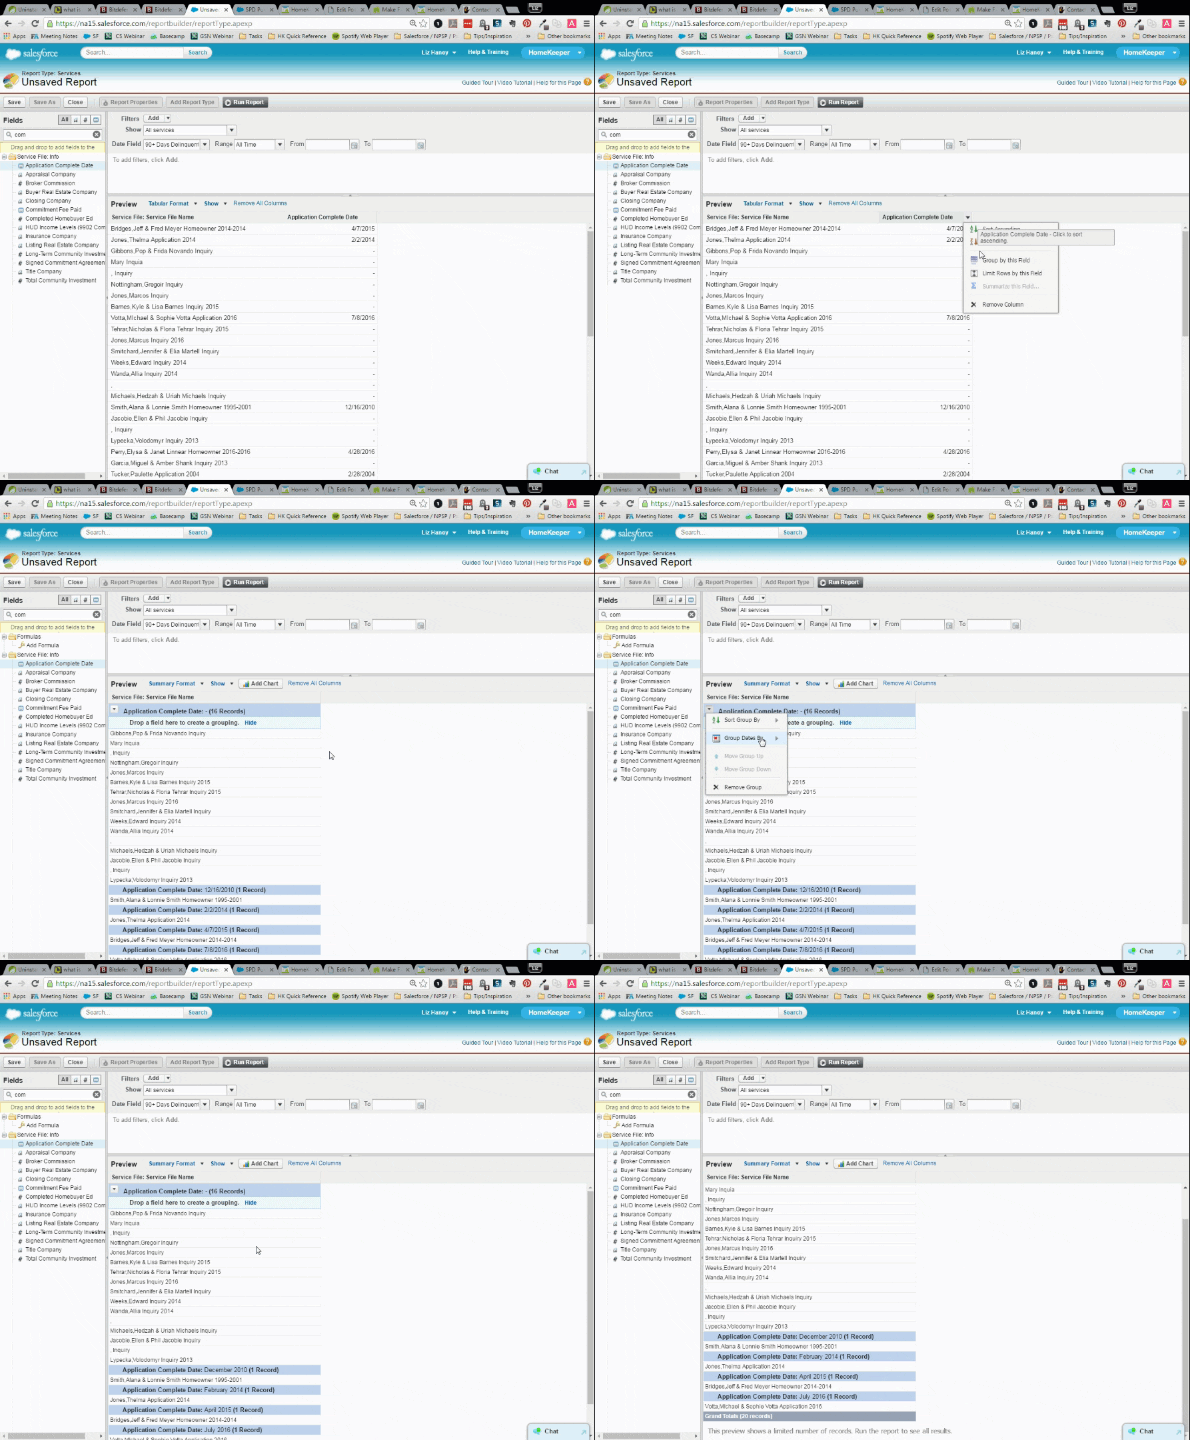
It’s not very helpful to group your Service Files by Application Date, if it’ll only group dates by the literal day you received applications. Luckily, in Salesforce you can broaden date groupings to week, month or even year. Once you click “Group by Date” you’ll have the option to group dates by Calendar Week, Month Quarter or Year.. which are much more helpful for noticing trends!
3. Summarize fields to get the Max, Min, Average or Sum
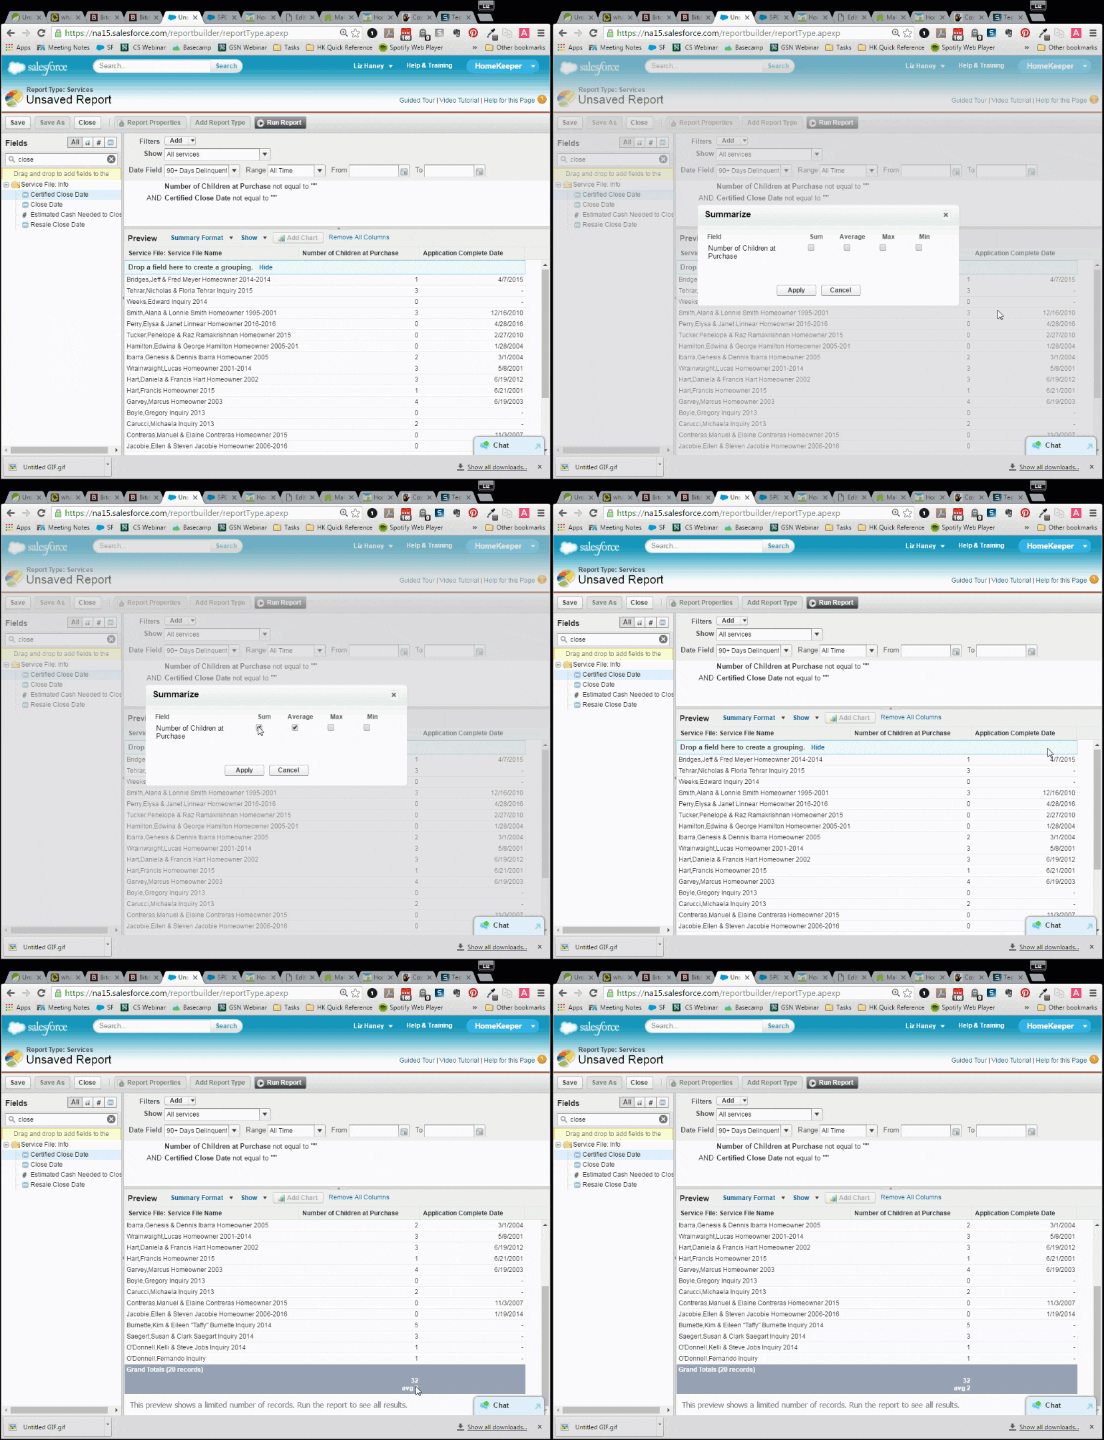
Sometimes you don’t just want “record counts.” Luckily, you can choose to summarize number type fields and calculate the max, min, average or sum (or all at once!) of your data. If you don’t have a field grouping you’ll just see the calculations at the bottom of the page. but if you have groupings, you’ll see the summary on each grouping as well!
4. Sort by data that isn’t even on the page using Cross Filters
 Sometimes, you want to be able to filter your Service Files by characteristics of the Property they live in, or by characteristics of their loan. This means you can leverage one Report Type, while filtering by data you can’t even see in the report.
In this example, we want to see all the Service Files with a Funding Source that has “Bank of America” in the name (This works if my organization consistently uses the Lender’s name in the Funding Source Name).
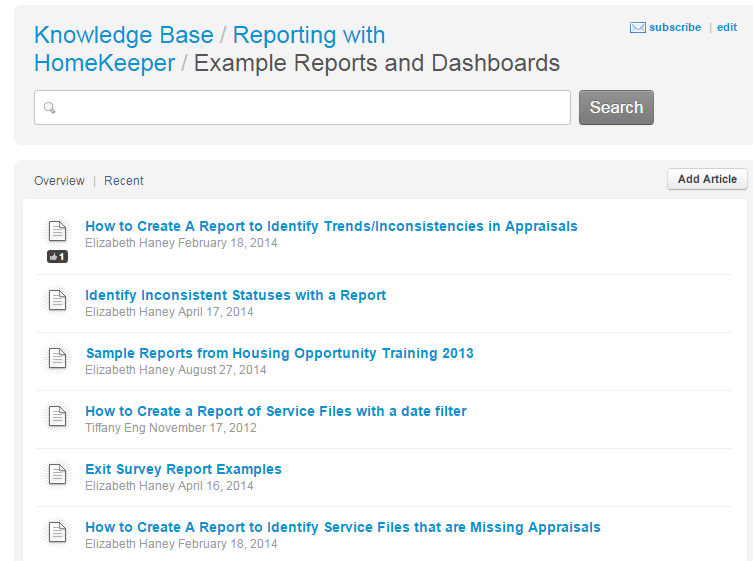
5. Use our example reports in the Support Forums.
Maybe these earlier tips feel like a bit much, but there’s an easier way. In our trainings, office hours and 1-1’s with users, our team has produced a lot of reports. Whether you’re interested in tracking past homeowners or your loan funds, check to see if we’ve already created a sample report that you can duplicate to meet your needs.
Conclusion
These are just a few of our favorite reporting tips. Sometimes it just takes a quick show and tell to get you to the reports you need. Join us at office hours and trainings to learn more (Subscribe to the User Announcements to stay up to date.). We hope these tips will take your reporting to the next level!
